Pivot Point Strategy In Forex Trading system V1.03

Pivot Point Strategy In Forex Trading system V1.03
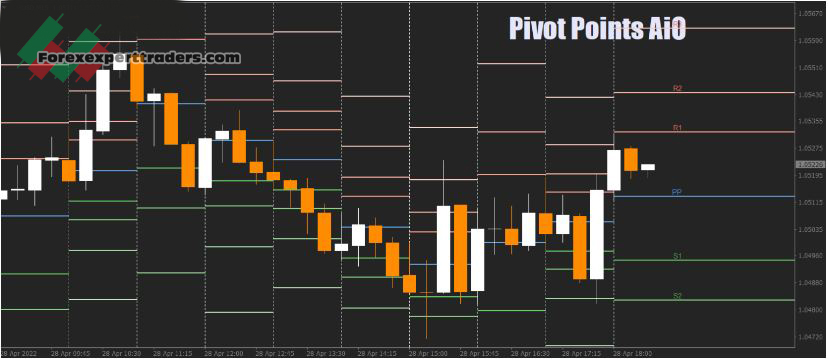
The Pivot Point Strategy In Forex Trading uses the most prominent calculation techniques to automatically generate crucial Pivot Levels in the MT4 terminal: Classical, Camarilla, Woodie, Fibonacci, and CPR.
For MT4, it’s arguably one of the greatest Pivot indicators. It’s also completely free and can be downloaded without having to register.
Category: Indicator
Platform: MT4
Currency Pair: All pairs
Trading Time: All sessions
Timeframe: All timeframe
Grade: B / ★★★✩✩
How Do I Use Them?
Pivot Point Strategy In Forex Tradings has been based on the premise that the price is far more likely to reach yesterday’s closure point than to transcend the prior day’s range. As a result, the most often used computation period for Pivot Points is Daily.
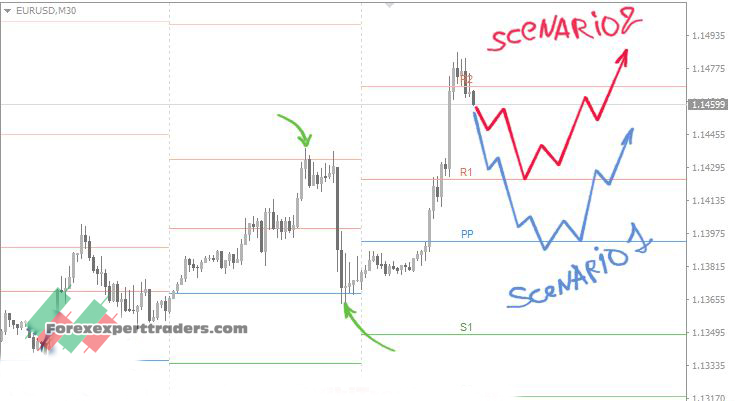
All Pivot levels serve both support and resistance in this situation.
We may detect various price interactions with these levels while looking at the chart.
One of the Pivot Point Strategy In Forex Trading merits is its widespread use; the more traders who use the same instrument, the more likely the price will interact with it.

Fibonacci
The Fibonacci number theory is often employed in the Forex market. Pivot Points are no different. The levels of resistance and support are calculated using this approach by multiplying the range (R) by the relevant Fibonacci numbers.
Camarilla
Camarilla levels are substantially closer to the present price, therefore interactions with them happen a lot more frequently. This method is appropriate for people who engage in short-term trading.
Please notice that the PP calculation above differs from the widely used Camarilla approach. We’ve adjusted the calculation because the conventional method produces a level that doesn’t match the logic of other support and resistance levels.
Woodie
This method is identical to the original one, except when computing the basic PP line, greater emphasis is placed on the period’s closing price.
Classic (Floor)
Calculating Pivot Points with this approach is the most popular. The primary (blue) line serves as a crucial support/resistance level in this diagram.
Central Pivot Range (CPR)
It’s a more advanced variant of the traditional Pivot Point calculations. This indication is unique in that it lacks the traditional support and resistance levels. Instead, the Central Pivot Range consists of three pivot lines: a central one, as well as upper and lower bounds.
CPR formula :
TC = (Pivot – BC) + Pivot
Pivot = (High + Low + Close)/3
BC = (High + Low)/2
Here we have:
TC – Top Central Pivot;
Pivot – Central Pivot;
BC – Bottom Central Pivot.
CPR aids a trader in predicting future market conditions by examining whether pivots are higher or lower over time, or if range breadth is narrowing or broadening.
If CPR is narrow for several days, for example, it typically suggests a large breakout or breakdown in the near future. Alternatively, if the market closes above the day’s CPR, it might be a hint of optimistic tendencies for the next day.
Pivot Point Strategy In Forex Trading system V1.03 download link


