Total Trend Trading System
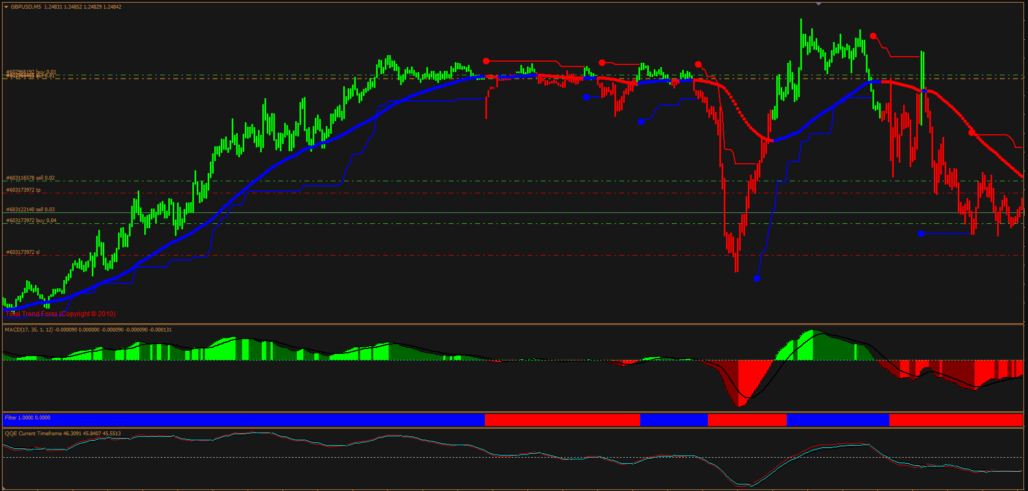
Total Trend Trading System
Total Trend System is a Trend Trading System that stands out as an integrated approach that combines trend following, momentum, and volatility analysis to create a holistic market view. The Total Trend Trading System is a time-tested methodology that has been a part of the forex market for a very long time. It has garnered a mixed response, with many applauding its effectiveness while others remain less enthusiastic.
At its core, the Total Trend System is a technical analysis methodology that aims to identify potential buy and sell signals in the financial markets. It achieves this by employing a combination of moving averages, momentum indicators, and volatility measures, each of which provides a unique perspective on market activity. This diversified approach allows traders to capture a comprehensive picture of market trends and potential shifts in market direction.
Understanding this Trend Trading System
Using Moving Averages
A vital component of the Total Trend Trading System is moving averages, statistical measures that smooth out price data by creating a constantly updated average price. This tool is instrumental in identifying the overall trend of the market.
In the Total Trend System, multiple moving averages are used concurrently to gauge short-term, intermediate, and long-term trends. For instance, a short-term moving average, like a 10-day moving average, can determine short-term trends. On the other hand, a longer-term moving average, such as a 50-day moving average, can be used to identify intermediate-term trends. This multi-timeframe analysis provides a more nuanced view of market trends and helps avoid the pitfalls of over-reliance on a single time frame.
Incorporating Momentum Indicators
The Total Trend Trading System employs momentum indicators like the Relative Strength Index (RSI), Moving Average Convergence Divergence (MACD), and moving averages. These tools offer insights into the strength of the ongoing market trend and can help confirm signals generated by moving averages.
The RSI, for example, compares the magnitude of recent gains to recent losses in an attempt to determine the overbought or oversold conditions of an asset. The MACD, the other hand, tracks the relationship between two moving averages of an asset’s price. The MACD triggers technical signals when it crosses its signal line above (to buy) or below (to sell).
Buy Entry
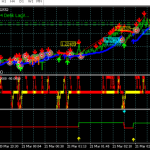
- The primary Volty Channel indicator gives BLUE Dot Signal.
- Red and Blue Moving average Indicator showing uptrend with BLUE.
- The MACD has crossed GREEN upward.
- The Red and Blue second window indicator is BLUE.
- QQE above the 50 lines.
Sell Entry
- The primary Volty Channel indicator gives RED Dot Signal.
- Red and Blue Moving average Indicator showing downtrend with RED.
- The MACD has crossed RED downward.
- The Red and Blue second window indicator is RED.
- QQE below the 50 lines.
Total Trend Trading System download link

