Kforex Scalping System Forex

description
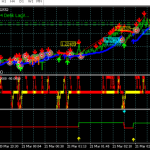
KForex is a fairly simple paid indicator that is displayed at the bottom of the chart as a kind of histogram. Its author, of course, tells how you can fabulously get rich with it, but this is all nonsense. Any indicator is a potential component of the system, but it cannot personify it. Simply put, if you work according to the readings of only one indicator, then in the end it will all end in disaster. On my own behalf, I can say that I have slightly “twisted” the KForex indicator in my hands and I can note that it is really curious. It can be used in both Forex and Binary Options. He is not particularly picky about trading assets, as for TF, it is better to work at least M5. The indicator signals are quite simple
buy Everything is elementary here, and even a person who came to the market yesterday will intuitively understand what is what. I quickly ran it in the tester for redrawing … The author states that the indicator does not draw at all, but this is not entirely true. Of course, he does not behave like a notorious artist, but sometimes the kid does paint on. In fact, this is all you need to know about the indicator itself. Let’s move on to more useful things and see how it can be used in practice.
Everything is elementary here, and even a person who came to the market yesterday will intuitively understand what is what. I quickly ran it in the tester for redrawing … The author states that the indicator does not draw at all, but this is not entirely true. Of course, he does not behave like a notorious artist, but sometimes the kid does paint on. In fact, this is all you need to know about the indicator itself. Let’s move on to more useful things and see how it can be used in practice.
As I said, it is stupid to trade by the color of the histogram – it would be a rash decision. It is necessary to work systematically, and now I will give an example of the simplest strategy

And then we see that we have a buy signal, because the indicator histogram has turned green. Great, we can open a trade by placing a stop at the local minimum level. We place a take in the area of the local resistance level . Specifically, in the example, the stop was about 15 points, and the take was just over 60 points. In total, the ratio came out 1: 4, which is quite good. If there is a growing trend in the older interval, we work only buy If the trend is down, we only work with sell If the trend is sideways – either refrain from trading, or carefully work in both directions In fact, this is an example of the simplest, most primitive, but, nevertheless, strategy. And I assure you, if you are a beginner, but will use it wisely, without risking most of the deposit in each transaction, then at least you will not drain

