Gartley Patterns Detector

Gartley Patterns Detector
The Gartley Pattern is one of the most traded harmonic patterns and can be applied to many markets and timeframes. It is a 5-point retracement structure that was originally outlined by H.M. Gartley and detailed further by Scott Carney. It has specific Fibonacci measurements for each point within its structure and it is important to note that D is not a point, but rather a zone in which price is likely to reverse, called the Potential Reversal Zone (PRZ). The B point retracement of the primary XA leg lies at 0.618 and the PRZ consists of 3 converging harmonic levels: 1) 0.786 retracement of the primary XA leg, 2) AB=CD pattern and 3) the BC projection is either 1.27 or 1.618.
The first target would be the 382 retracement of AD and the second target the 618 retracement of AD. A common stop level would be behind the X-point. Conservative traders may look for additional confirmation. Gartley Patterns can be bearish and bullish. TradingView has a smart XABCD Pattern drawing tool that allows users to visually identify 5-point reversal structures on a chart.

How The Gartley Pattern MT4 Indicator Works
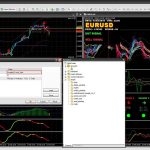
Once you’ve saved the indicator in your Indicators folder, you simply upload it onto your chart.
1.You really don’t have to do anything like changing settings.
2.Depends on which timeframe you want to trade in, the gartley indicator will give you the buy or sell signal when the it spots a gartley pattern.
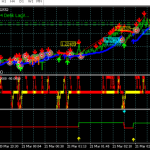
As you can see on the chart above that a bullish gartley pattern signal was generated by the blue arrow pointing up. And you can see how price is not moving up after that buy signal was generated.
- This gartley pattern indicator works on all timeframes therefore if you don’t see a gartely pattern indicator on the 1 hour chart then try the 4 hour chart. If you cannot see on the 4 hour chart then try the daily chart. Why is this? Because a gartley pattern can form on the 4 hour chart but not on the daily chart.
- But at the end of the day, it really depend on you and what timeframe you want to trade in
Gartley Patterns Detector download link


