Megastorm forex robot
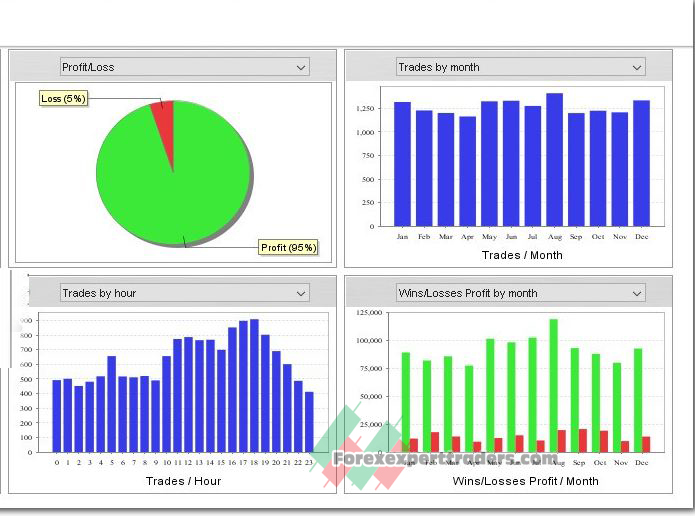
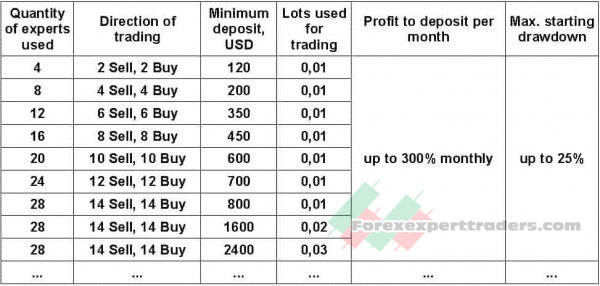
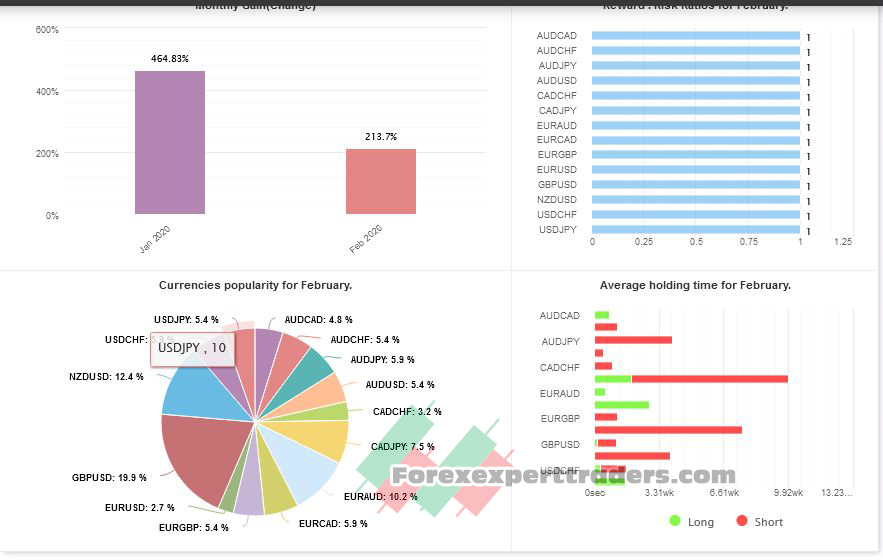
Profit to deposit per month: up to 300% monthly
Max starting drawdown: up to 25%
System: Metatrader 4
Need Metatrader indicators: 12 indicators are included
Timeframe: H1
Currency pair: AUDCAD, AUDCHF, AUDJPY, AUDUSD, CADCHF, CADJPY, EURAUD, EURCAD, EURGBP, EURUSD, GBPUSD, NZDUSD, USDCHF, USDJPY,
Limits by accounts: No
Limits by time: No
Type of trading: Middle-term automated trading 50%, Long-term automated trading 50%
Neural network: middle
Number of signals using in trading: 6
Money management: yes
Using with other EAs: yes (do not use magics 10xxx)
Broker account: any
Max. spreads allowed:: internal spread auto security
TakeProfit and StopLoss: auto (SL), up to 55 (TP)
Duration of trades: average 4 hours – 4 days
Lots: 0,01 – 100
VPS or Laptop: need 24/5 online
Min. configuration of VPS, Laptop: 1 core, 1 GB RAM
Megastorm forex robot,We are constantly working on improving our trading strategy and have released this new robot. Robots receive signals for opening deals from indicators included in the pack. Using a large number of currency pairs and small lots, absolutely safe Forex trading is achieved. At the same time, while trading 28 robots at the same time, you can get a large percentage of monthly profit.
Using indicators:
Pattern Recognition;
KeltnerChannel;
Linear Regression;
Aroon Up & Down;
Average volume;
Pivot points;
QQE indicator;
RSI;
BBandWidthRatio;
Commodity Channel Index (CCI);
Momentum;
TEMA indicator;
Pattern Recognition – an information technical indicator that finds and displays a number of the most popular figures of candlestick analysis and on its basis sends signals.
Keltner Channels are volatility-based envelopes set above and below an exponential moving average. Keltner Channels are a trend following indicator used to identify reversals with channel breakouts and channel direction. Channels can also be used to identify overbought and oversold levels when the trend is flat.
Linear Regression – trend indicator. Its main task is to point to the current trend. Its direction and strength, as well as signaling about market corrections.
Aroon Up & Down indicator – defines local vertices and valleys on the chart and provides signals to buy and sell currency pairs when they rise from the bottom or fall from the top.
BBandWidthRatio – indicator is based on the Bollinger Bands and is used to determine market volatility.
Commodity Channel Index – The CCI compares the current price to an average price over a period of time. The indicator fluctuates above or below zero, moving into positive or negative territory.
Momentum – technical indicator, the purpose of which is to measure the amount of change in the price of a financial instrument for a certain period.
RSI – the relative strength index (RSI) is a momentum indicator, that compares the magnitude of recent gains and losses over a specified time period to measure the speed and change of price movements of a security. It is primarily used to attempt to identify overbought or oversold conditions in the trading of an asset.
TEMA indicator – a technical indicator used for smoothing price and other data. It is a composite of a single exponential moving average, a double exponential moving average, and a triple exponential moving average.
